News & Events
Mastering the Bradford Protein Assay Protocol in 2025

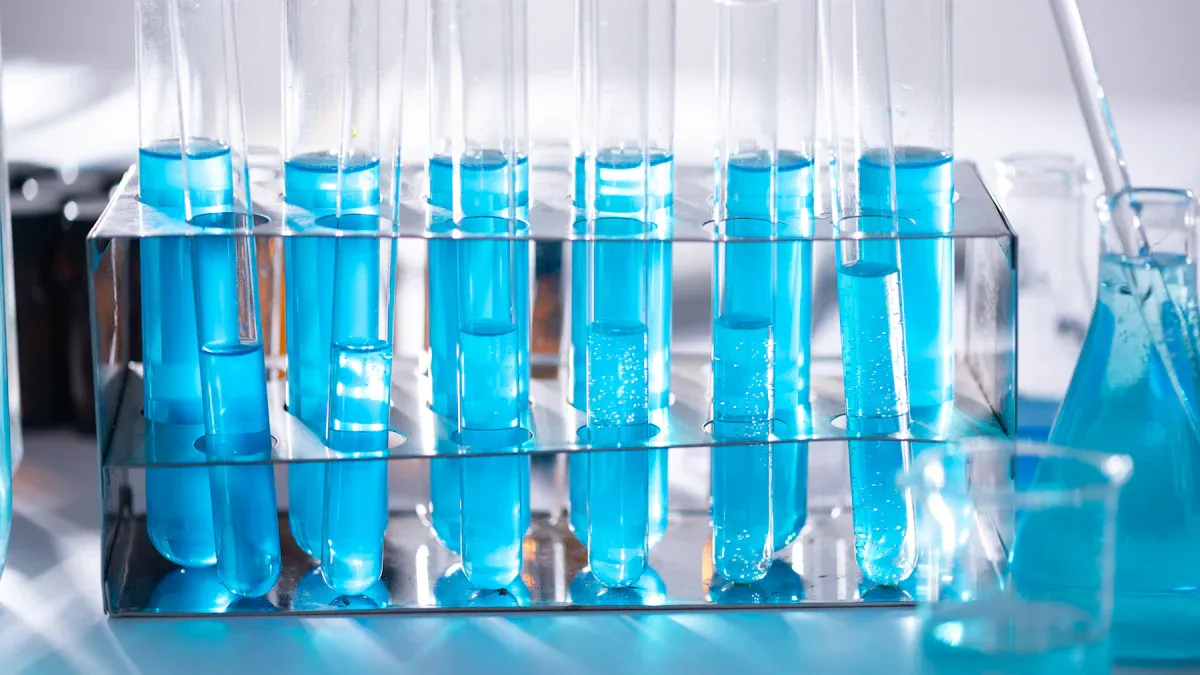
You can master the bradford protein assay protocol in 2025 by following updated methods and using reliable training tools. This assay remains a favorite in research labs because it is simple, fast, and cost-effective.
Dye-binding assays, like the bradford protein assay, now hold about 40% market share.
They are popular for their ease of use and fit well with high-throughput screening.
Modern labs depend on accurate protein quantification, which supports better research and clinical diagnostics. Virtual simulations and new automated systems help you improve your skills and results.
Key Takeaways
The Bradford protein assay is a simple and cost-effective method for measuring protein concentration, making it essential for research and diagnostics.
Accurate protein quantification is crucial for understanding disease mechanisms and evaluating drug effects, which can lead to advancements in personalized medicine.
Proper preparation and calibration of equipment are vital for reliable results; always check your reagents and use fresh standards.
When building a standard curve, select protein standards that closely match your sample type to ensure accurate measurements.
Troubleshoot common issues like low absorbance readings by checking for interfering substances and ensuring proper sample preparation.
Protein Quantification
Importance
You need to measure proteins because they play a key role in every living cell. Proteins help cells respond to changes and carry out important functions. When you study proteins, you learn how cells work in health and disease.
“In the central dogma of genetics, proteins represent real-time biology as they are dynamic and actionable targets in both health and disease. Moreover, proteins represent the impact of environmental and lifestyle factors to cellular phenotypes as cells respond to external stimuli.”
You often quantify proteins to:
Evaluate drug effects
Confirm gene expression at the protein level
Discover biomarkers and therapeutic targets
Proteins influence many life processes, such as cell signaling, metabolism, and immune responses. By analyzing protein levels, you gain insights that drive progress in diagnostics, biotechnology, and personalized medicine.
Lab Applications
You use protein quantification in many laboratory tasks. The Bradford assay helps you measure protein concentration quickly and accurately. This step is important before you move on to other experiments.
Protein Purification: You check protein concentration after each purification step. This helps you track yield and purity.
Cell Lysate Preparation: You need to know the protein amount in your samples. This ensures you use equal amounts in each test.
Sample Preparation for SDS-PAGE: You load equal protein amounts in each gel well. This makes your results reliable and easy to compare.
Aspect | Details |
|---|---|
Linearity | Assay shows linearity with BSA samples from 100 µg/mL to 1,750 µg/mL. |
Accuracy | Recovery of spiked tumor lysates met the acceptance criterion of 100 ± 5%. |
Precision | Coefficient of variation (CV) was less than 5% for hexaplicate analyses. |
Detection Limit (DL) | Calculated from standard deviation of hexaplicate blank measurements. |
Quantification Limit (QL) | Determined to be 40–100 µg/mL. |
Validation Methodology | Includes standard curve in triplicate, samples in triplicate, and negative controls. |
Reference Curve Quality | Measured by correlation factor and slope of linear fit. |
Data Analysis | Conducted using a validated Microsoft Excel spreadsheet. |
Advantages of Method | Compared to other assays, it has a large linear range and good tolerance for buffer compositions. |
You must select the right standards and validate your process. This ensures your results are accurate and reliable every time.
Bradford Protein Assay Principle
Dye Interaction
You use the Bradford protein assay because it relies on a special dye called Coomassie Brilliant Blue G-250. When you add this dye to your protein sample, it reacts quickly. The dye binds mainly to arginine residues in the protein, but it also interacts with other amino acids. This binding happens through noncovalent forces, such as Van der Waals and ionic interactions. The dye exists in three forms: cationic (red), neutral (green), and anionic (blue). In acidic conditions, the dye starts as red. When it binds to proteins, it shifts to the blue form.
Tip: The dye binds best to proteins with more arginine. If your sample has detergents or a lot of membrane proteins, you may see less accurate results.
Here is a summary of how the dye interacts with proteins:
Interaction Type | Description |
|---|---|
Dye Forms | Coomassie Brilliant Blue G-250 exists in cationic, neutral, and anionic forms. |
Binding Mechanism | The anionic (blue) form binds to proteins, especially at arginine residues. |
Interaction Forces | Binding involves Van der Waals and electrostatic interactions. |
Assay Interference | Detergents and bases can disrupt dye binding and affect accuracy. |
Absorbance Shift
When you perform protein determination with the Bradford assay, you measure a color change. The dye shifts from reddish-brown to blue as it binds to proteins. You can see this change with your eyes, but you measure it more accurately using a spectrophotometer. The absorbance moves from 460 nm (red form) to 595 nm (blue form). The more protein you have, the stronger the blue color. You compare your sample’s absorbance to a standard curve made with known protein concentrations. This lets you find out exactly how much protein is in your sample.
The assay gives a linear response for protein concentrations between 62.5 and 1000 µg/ml.
If you use samples with detergents or membrane proteins, you may get lower readings.
The Bradford method is fast and sensitive, but it works best with samples that do not contain interfering substances.
Note: Always check your standard curve for accuracy. This helps you avoid errors in your results.
Assay Protocol

Materials
You need the right materials to perform the bradford protein assay in 2025. Many labs now use updated kits that improve accuracy and save time. Here is a table showing some of the most popular kits and their features:
Kit Name | Description | Key Features |
|---|---|---|
A sensitive assay for protein concentration using Coomassie Brilliant Blue G250. | Suitable for serum, plasma, animal tissues, and cells. | |
Thermo Scientific™ Pierce™ Bradford Protein Assay Kit | A ready-to-use formulation that changes color from brown to blue based on protein concentration. | Includes Coomassie Protein Assay Reagent and Albumin Standard Ampules. |
You also need:
1x Bradford reagent
1x PBS (phosphate-buffered saline)
Cuvettes or 96-well plates
Micropipettes and tips
Protein standards (such as BSA)
Spectrophotometer set to 595 nm
Tip: Always check that your equipment is calibrated before you start. This helps you get reliable results.
Preparation
Proper preparation ensures accurate and reproducible results. You should follow these best practices:
Centrifuge your samples at 8,000–15,000 × g for 10–15 minutes to remove debris.
Reduce or eliminate detergents and salts in your samples. These can interfere with dye binding.
Choose a standard protein that closely matches your sample type for better protein determination.
Prepare fresh protein standards that cover the expected concentration range. This helps you create standard curve with a linear fit (R² > 0.98).
Adjust the pH of your samples to 6.5–7.5. This range supports optimal dye–protein interaction.
Use the same equipment for all measurements and check calibration before each assay.
Note: If you use samples with humic acid or other interfering substances, you may see false positive results. Always control your sample conditions to avoid errors.
Procedure
You can follow these step-by-step instructions for the bradford assay protocol in 2025:
Gather all materials, including 1x Bradford reagent, 1x PBS, cuvettes, and protein standards.
Label two cuvettes: one as ‘control’ and one as ‘sample.’
Add 20 µL of diluted protein sample to the sample cuvette. Add 20 µL of 1x PBS to the control cuvette.
Serially dilute your protein standards and label each cuvette. Add 20 µL of each standard to its cuvette.
Add 1 mL of 1x Bradford reagent to each cuvette. Mix thoroughly.
Incubate the cuvettes for 5 minutes at room temperature.
Set your spectrophotometer to zero absorbance using a blank.
Measure the absorbance of each sample and standard at 595 nm.
Create standard curve by plotting absorbance values against protein concentrations in µg/mL.
🧪 Always use a blank to zero the spectrophotometer. This step removes background absorbance and improves accuracy.
You can now use your standard curve to determine the protein concentration in your unknown samples. If you see unexpected results, check for interfering substances or errors in sample preparation. Careful attention to each step of the protocol helps you achieve reliable and reproducible results with every assay.
Standard Curve

Protein Standards
You need to choose the right protein standards to build a reliable standard curve for your bradford protein assay. The standard you select should match your sample type as closely as possible. This helps you get accurate results when you measure protein concentration. Most labs recommend these protein standards:
Bovine serum albumin (BSA)
Gamma globulin
BSA is the most common choice because it gives consistent results and is easy to handle. Gamma globulin works well if your samples contain more globular proteins. Always prepare your standards fresh and use the same buffer as your samples. This reduces errors and keeps your assay results trustworthy.
Tip: Store your protein standards at low temperatures and avoid repeated freeze-thaw cycles. This keeps the proteins stable and prevents degradation.
Curve Analysis
After you prepare your standards and run the assay, you need to analyze the standard curve. You plot the absorbance values of your standards against their known concentrations. This curve lets you find the concentration of unknown samples by comparing their absorbance to the curve.
You should always check the quality of your standard curve. Use these methods to validate your results:
Method | Description |
|---|---|
Linearity | Absorption of eight BSA samples (100–1,750 µg/mL) shows a direct link to concentration. |
Accuracy | Tumor lysates spiked with BSA recover within 100 ±5% of the expected value. |
Precision | Coefficient of variation stays below 5% for repeated tests of 500 µg/mL Jurkat cell extracts. |
Detection Limit | Calculated from blank measurements; quantification limit falls between 40–100 µg/mL. |
Specific Layout | Run the standard curve and samples in triplicate, and include negative controls for quality. |
A good standard curve should be straight and pass through the origin. If you see any curve or outliers, check your pipetting and sample preparation steps. Reliable curve analysis ensures your bradford results are accurate and repeatable.
Sample Measurement
Dilution
You need to prepare your samples carefully before measuring protein concentration. If your sample has a high amount of protein, you should dilute it to fit within the linear range of the standard curve. This step helps you avoid errors and ensures accurate readings. Use the following table to guide your dilution choices:
Sample Type | |
|---|---|
High Protein | 1:2, 1:25, 1:50 |
Low Protein | Use as-is or dilute as needed |
Start with a small test dilution if you are unsure about your sample’s concentration. Always mix your samples well after dilution. This practice helps you get consistent results during the bradford assay.
Tip: Use the same buffer for diluting both your samples and standards. This reduces background noise and improves accuracy.
Data Analysis
After you measure the absorbance of your samples, you need to analyze the data for protein determination. Make sure your samples fall within the linear range of your standard curve. If your readings are too high or too low, repeat the measurement with a different dilution.
Researchers have found that the bradford method can show more variation in results, especially at higher concentrations. This means you must use consistent methods and check your results carefully. Some studies compared different calculation models and found that Model 2 gave more reliable values than Model 1, which often overestimated protein amounts. Choosing the right calculation method is important for accurate data.
Always check for reproducibility by running samples in triplicate.
Use statistical analysis to confirm your results are significant.
Watch for variability caused by protein type. Proteins with many basic or hydrophobic amino acids can give higher absorbance values.
Post-translational modifications, like glycosylation, can cause underestimation of some proteins.
Note: If you work with special proteins, such as collagen or plant proteins, consider using modified versions of the assay to improve accuracy.
Careful attention to dilution and data analysis helps you get trustworthy results every time you measure protein concentration.
Troubleshooting
Common Issues
You may face several problems when you run the Bradford protein assay. Sometimes, you see low or inconsistent absorbance readings. This can happen if you use old reagents or if your samples contain detergents. Detergents can stop the dye from binding to proteins. You might also notice bubbles in your cuvettes or wells. Bubbles can block light and give false readings.
If your standard curve does not look straight, check your pipetting steps. Uneven mixing or using different pipettes can cause errors. Always use clean tips and mix your samples well. If you see a color that is not blue, your sample may have interfering substances. Make sure you use the same buffer for both your samples and standards.
Tip: Always run a blank and negative control with each batch. This helps you spot problems early.
Optimization
You can improve the accuracy and sensitivity of your results by making a few changes to your protocol. Try using standard addition. This method helps you move your measurements into the linear range of the curve, which gives you better accuracy. You can also increase your sample volume from 25 to 150 μL. A larger volume improves the limit of quantification because the path length for absorbance increases.
Some labs now question the use of bovine serum albumin (BSA) as the only reference protein. If your sample is very different from BSA, try using a standard that matches your sample type. This change can improve the fit of your standard curve.
Use standard addition for better accuracy.
Increase sample volume to boost sensitivity.
Choose a reference protein that matches your sample.
Note: Small changes in your protocol can make a big difference in your results. Always record any adjustments you make.
Bradford Assay Applications
Sample Types
You can use the bradford protein assay with many types of biological samples. This flexibility makes it a popular choice in labs. The assay works well with samples that contain different chemicals, such as denaturing agents, reducing agents, and buffers. You can also use it with tissue culture media, sugars, nucleic acids, and even some detergents. The table below shows common sample types and examples you might encounter:
Type of Sample | Examples |
|---|---|
Denaturing agents | Sodium thiocyanate, guanidine HCl, urea, phenol |
Reducing agents | Dithiothreitol, β-mercaptoethanol |
Buffers | HEPES, MES, MOPS, Tris, phosphate |
Chelating agents | EDTA, EGTA |
Salts | NaCl, KCl, MgCl2 |
Tissue culture media | Eagle’s MEM, Hank’s salt solution |
Sugars | Sucrose, glucose, fructose |
Nucleic acids | DNA, RNA |
Glycerol | Glycerol |
Organic solvents | Acetone, methanol, ethanol |
Detergents | Triton™ X-100, deoxycholate, low SDS |
Free amino acids | Small peptides (<3 kDa) |
Note: You should always check if your sample contains high levels of interfering substances. Some detergents or organic solvents can affect the color change in the assay.
Research Uses
You will find the bradford assay in many research fields. Scientists use it to measure protein levels in cell extracts, purified proteins, and even environmental samples. The assay helps you compare protein concentrations across experiments. Researchers have improved the method over time. For example, Zor and Selinger (1996) showed that changing the way you plot the data can make the assay more sensitive. Compton and Jones (1985) explained how the dye works and what can interfere with the results. The table below highlights these important studies:
Study | Authors | Year | Key Findings |
|---|---|---|---|
Protein quantification in ecological studies | Zor, T., & Selinger, Z. | 1996 | Linearization of the Bradford protein assay increases its sensitivity. |
Mechanism of dye response and interference | Compton, S. J., & Jones, C. G. | 1985 | Discusses the mechanism of dye response and interference in the Bradford protein assay. |
You can use the bradford protein assay for many tasks, such as checking protein purity, monitoring protein extraction, and studying protein changes in disease. This makes the bradford method a key tool in both basic and applied science.
You can master the Bradford protein assay by following each step with care. Accurate pipetting, proper calibration, and careful troubleshooting help you get reliable results. The table below shows how small changes in reagent volume or assay time can affect your results:
Parameter | Value |
|---|---|
Accuracy | 94.1 ± 6.4% |
Precision | 3.1% |
Linear Range | 0.1–3.0 mg/mL |
Always check your measurements.
Optimize your assay conditions.
Watch for errors in your results.
A quick-reference checklist keeps your workflow smooth and your results consistent.
FAQ
What is the best protein standard for the Bradford assay?
You should use bovine serum albumin (BSA) as your standard. BSA gives reliable results and matches most sample types. If your sample is very different from BSA, choose a standard that is more similar.
How do you handle samples with detergents?
Detergents can interfere with the Bradford assay. You should remove or dilute detergents before testing. If you cannot remove them, use a compatible assay kit or try a different protein quantification method.
Can you reuse Bradford reagent?
You should not reuse Bradford reagent. Always use fresh reagent for each test. Old or used reagent can give inaccurate results and lower your assay’s sensitivity.
What should you do if your standard curve is not linear?
Check your pipetting steps and make sure you mixed your samples well. Use fresh standards and reagents. If the curve still looks wrong, repeat the assay and check for interfering substances.
How long can you store prepared samples before testing?
You should test your samples as soon as possible. If you need to store them, keep them at 4°C for up to 24 hours. For longer storage, freeze your samples at -20°C or lower.

