News & Events
Easy Methods to Analyze MBP Expression with Takara Protein Markers in 2025

Sep

You want a simple way to check mbp expression in your samples. Many labs use mbp because it helps proteins stay soluble and makes purification easier. If you choose mbp as your affinity tag, you get better results during protein production. Takara protein marker gives you clear bands so you can spot mbp quickly. Capturem technology helps you purify mbp in less time.
Tip: Using mbp lets you see if your protein is present and pure. This saves you time and effort during analysis.
Key Takeaways
- MBP enhances protein solubility and stability, making it easier to purify recombinant proteins.
- Using Takara protein markers provides clear bands for accurate identification of MBP and other proteins during analysis.
- Capturem technology allows for quick purification of MBP, saving time and improving efficiency in protein analysis.
- Follow a stepwise protocol for sample preparation and SDS-PAGE to ensure reliable results and high protein yield.
- Optimize growth conditions and use proper buffers to increase the yield of MBP-tagged proteins.
MBP and Takara Protein Marker Basics
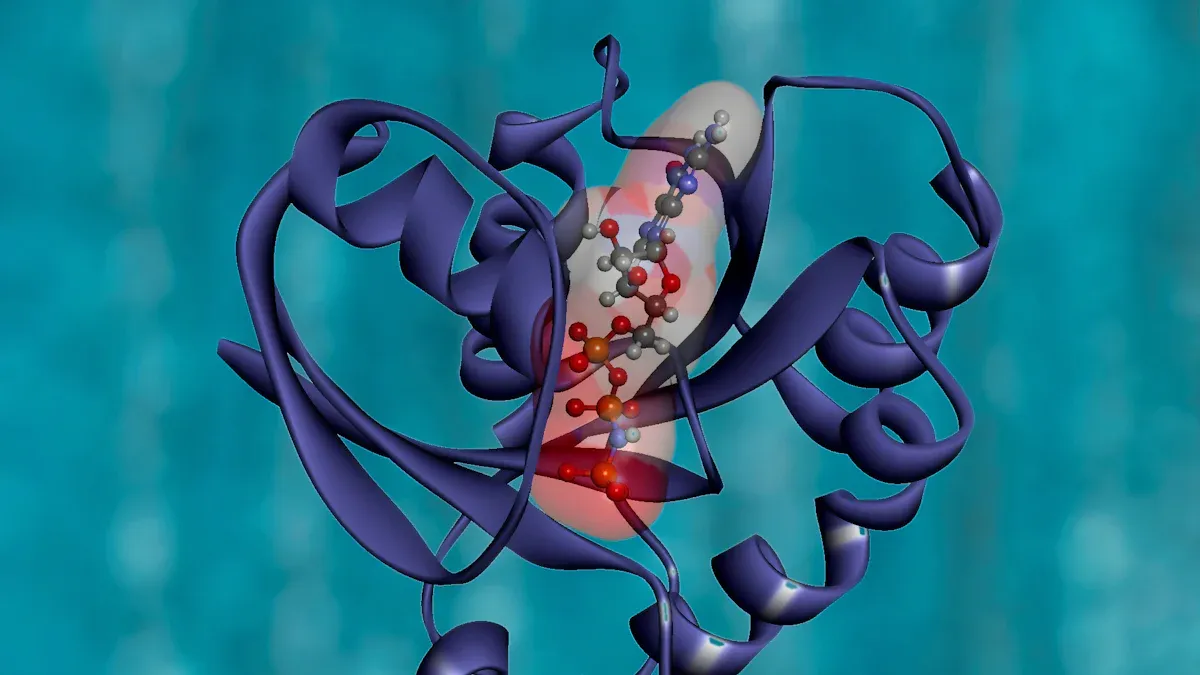
MBP (Maltose-Binding Protein) Overview
You often see mbp used as a fusion tag in recombinant protein research. Scientists choose mbp because it helps proteins stay soluble and stable. When you attach mbp to your target protein, you can improve its yield and folding. The maltose binding protein works well at both the N-terminus and C-terminus, giving you flexibility in your experiments.
- MBP enhances yield, solubility, and stability of fusion partners.
- It acts as a chaperone, helping proteins fold correctly.
- MBP binds to maltose, which makes purification easier.
- You can use MBP to solve problems with difficult-to-express proteins.
- The large hydrophobic cleft in MBP supports proper folding.
Note: MBP tagging often produces higher yields than polyhistidine tags. You can use amylose resin-based chromatography to purify MBP-tagged proteins with a mild buffer at neutral pH.
Here is a quick look at common applications for MBP-tagged proteins:
| Application | Description |
|---|---|
| Enhancing protein solubility | MBP-tagged proteins can alleviate toxicity and improve expression levels and solubility. |
| Purification processes | Purification is achieved using amylose resin-based chromatography, with elution at neutral pH. |
| Higher yield compared to others | MBP tagging may produce a higher percentage of recombinant protein than polyhistidine tags. |
Takara Protein Marker Use
You need a reliable way to check your protein samples. The takara protein marker gives you clear, sharp bands on your gel. This helps you identify mbp and other proteins quickly. When you run SDS-PAGE, the takara protein marker acts as a reference, so you know exactly where your mbp should appear.
- Takara protein marker provides accurate molecular weight standards.
- You can use it to confirm the presence and purity of mbp in your samples.
- The marker helps you troubleshoot if you see faint or missing bands.
Capturem technology makes purification even faster. You can isolate mbp directly from cell supernatants in minutes. This method works well, even if your samples contain additives that might interfere with other purification techniques.
Tip: Use takara protein marker with Capturem technology to save time and get reliable results when analyzing mbp expression.
Expression and Purification Steps

Sample Preparation
You start the process by preparing your samples for maltose-binding protein analysis. You need to use the right protocol to get reliable results. Begin with template DNA. Use PCR with F1-primer and R1-primer. Select pRSETb-MBP-KojR-FL or pRSETb-MBP-KojR-BD as your template. Mix cysteine, GSH, Solution I, II, III, template DNA, and ZnCl2 to create your reaction mixture. Incubate at 37 °C for two hours. Centrifuge at 15,000 rpm for five minutes. Separate the soluble fraction. Use this for binding reactions and SDS-PAGE to confirm protein expression. Visualize expressed proteins with a scanner that detects green fluorescence.
| Step | Description |
|---|---|
| 1 | Prepare template DNA using PCR with F1-primer and R1-primer. |
| 2 | Use pRSETb-MBP-KojR-FL or pRSETb-MBP-KojR-BD as the template. |
| 3 | Mix cysteine, GSH, Solution I, II, III, template DNA, and ZnCl2 to create a reaction mixture. |
| 4 | Incubate the mixture at 37 °C for 2 hours. |
| 5 | Centrifuge at 15,000 rpm for 5 minutes to separate fractions. |
| 6 | Use the soluble fraction for binding reactions and perform SDS-PAGE to confirm protein expression. |
| 7 | Visualize expressed proteins using a scanner capable of detecting green fluorescence. |
Tip: Always check that your fusion proteins are in the correct reading frame. Use Western blotting with Anti-MBP Monoclonal Antibody to confirm. Avoid non-ionic detergents and harsh lysis treatments. Add glucose to your growth media to repress amylase expression. This helps keep your maltose-binding protein ready for affinity purification. Use a host that lacks specific proteases and add protease inhibitors to prevent fusion protein degradation.
Marker Selection
You need to choose the right Takara protein marker for your analysis. The marker gives you clear, sharp bands and helps you identify maltose-binding protein and other fusion proteins. Always run gel electrophoresis markers alongside your samples. This lets you determine the size of your fusion tag and fusion protein. Use gel loading tips for precise sample dispensing. This reduces cross-contamination and improves accuracy.
Note: Select a marker that covers the expected size range of your fusion proteins. This ensures you can detect both the maltose-binding protein and any fusion tag.
SDS-PAGE Analysis
You analyze your samples using SDS-PAGE. This method separates fusion proteins by size. Treat your protein samples with SDS. This denatures the proteins and gives them a negative charge. Heat the samples at 95°C to break hydrogen bonds and linearize the proteins. Add reducing agents like BME or DTT to break disulfide bridges. Load the samples onto the polyacrylamide gel. The gel acts as a molecular sieve. Run the gel under an electric field. Proteins migrate toward the positive electrode based on size. Visualize the results with staining methods.
- Prepare protein samples with SDS.
- Heat samples at 95°C.
- Add reducing agents.
- Load samples onto the gel.
- Run the gel under an electric field.
- Visualize separated proteins.
Tip: Start running the gel as soon as you finish loading. This prevents sample diffusion and keeps your results accurate. If you load many samples, work quickly or reduce the number of samples. Follow the manufacturer’s recommendations for voltage and duration. Use 100-150 volts for 40-60 minutes.
Result Interpretation
You interpret your SDS-PAGE results by comparing the bands to the Takara protein marker. Look for the maltose-binding protein band at the expected size. Use specific buffers like MES at pH 6.1 to keep proteins in their native structure. The right pH helps prevent chemical reactions that could damage your fusion proteins. Silver staining works well for visualizing nucleic acids and analyzing E. coli lysates expressing maltose-binding protein.
Common artifacts can appear during analysis. You might see contamination with native E. coli proteins. This can cause unexpected bands. Sometimes, you purify the wrong protein. Mislabeling samples can also lead to errors. Always use good laboratory practices to avoid these problems.
Callout: Use controls like a GFP tag to monitor recombinant protein production. MBP acts as a solubility enhancer. A two-step purification process can yield 10 to 30 mg of purified, active fusion protein with over 80% purity.
For optimal expression and purification, use the following buffer conditions:
| Component | Final concentration | Stock | Amount |
|---|---|---|---|
| Tris–HCl, pH 8.0 | 50 mM | 1 M | 50 ml |
| NaCl | 200 mM | 1 M | 200 ml |
| EDTA | 1 mM | 0.5 M | 2 ml |
| Maltose | 10 mM | 0.5 M | 20 ml |
You achieve high expression and efficient affinity purification by following these steps. Capturem technology lets you complete expression and purification in one step. This gives you high yield and purity for recombinant protein production. You can use these methods for many fusion proteins and fusion tags. This workflow helps you get reliable results and supports high expression in your lab.
Troubleshooting and Optimization
Common Issues
You may sometimes see faint or missing mbp bands after SDS-PAGE. This problem often happens when you load too little protein. Try loading about 10 µg per well for clear results. Check that you add enough SDS to your samples. SDS gives proteins a negative charge, which helps them move through the gel. If you use too little SDS, mbp may not migrate properly. Always confirm that your n-terminal fusion is in the correct reading frame. If you still have trouble, review your sample preparation steps and make sure you use fresh reagents.
Tip: Double-check your protein concentration before loading. Use a colorimetric assay to measure it accurately.
Improving Detection
You want to detect mbp bands with high accuracy and reliability. Different detection methods give different results. The table below compares several methods for mbp analysis:
| Detection Method | Accuracy (MSE) | Reliability (Peak Identification) |
|---|---|---|
| Method III | 100% | High (Dynamic Thresholding) |
| Method V | 71% | High (Dynamic Thresholding) |
| Method IX | 86% | High (Elemental Decomposition) |
| Monopolar | Mean MSE = 3.2 | Improved Resolution |
| Bipolar | Mean MSE = 7.8 | Lower Resolution |
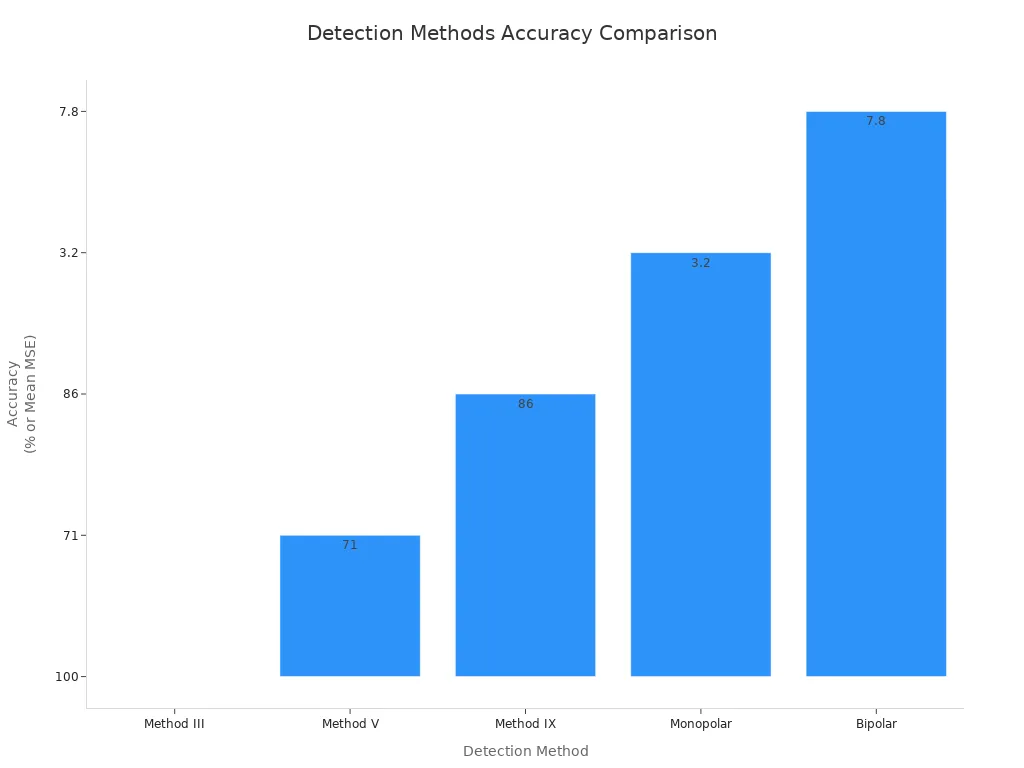
- Method III gives you the highest accuracy for mbp detection.
- Monopolar referencing improves beta peak identification.
- Algorithms III, V, and IX show strong performance with MSE values below 5.
For best results, use a detection method with high accuracy and reliability. This helps you confirm solubility enhancement and n-terminal fusion success.
Purification Success
You can achieve high purification success for mbp-tagged proteins by following key steps. Capturem technology gives you high purity and yield, which supports downstream purification. The protocol works quickly, so you reduce protein degradation. Use a high bed volume to wash buffer ratio, such as 1:300, for thorough washing. This step increases the purity of your eluates. Capturem works under both native and denaturing conditions, so you have flexibility for different samples. Short residence time saves you time and keeps your protein active.
| Factor | Description |
|---|---|
| High purity and yield | The protocol produces proteins with high purity and yield, enhancing downstream application success. |
| Speed of protocol | Reduces protein degradation or loss of activity, increasing the likelihood of successful applications. |
| Bed volume to wash buffer ratio | A high ratio (1:300) allows for thorough washing, leading to higher-purity eluates. |
| Performance under various conditions | Effective under native and denaturing conditions, and in the presence of common additives, providing flexibility. |
| Short residence time | Saves time and reduces the risk of protein degradation, contributing to higher success rates. |
After purification, you may want to remove the n-terminal fusion tag. You can use proteolytic cleavage for this step. The table below shows a typical protocol:
| Step | Description |
|---|---|
| 1 | Break the cells and purify the tagged protein using MBP-trap beads. |
| 2 | Dialyze the protein overnight to decrease salt and remove maltose. |
| 3 | Perform purification in an affinity column. |
| 4 | Use TEV protease to cleave the MBP tag from the protein. |
You can also co-express cells with 3C protease and your n-terminal fusion protein. After lysis, purify the His6-tagged protein, digest with TEV protease, and use gel filtration to remove aggregates. This process gives you a pure protein, ready for solubility enhancement studies or downstream purification.
You can analyze mbp expression and purification with Takara protein markers using clear, stepwise workflows. These methods help you get reliable results and high purity.
- mbp improves solubility and makes purification easier for recombinant proteins.
- Studies show mbp promotes solubility in some cases, though not always widely used.
- You can use mbp to solve problems with difficult proteins.
To keep mbp-tagged proteins stable for a long time, store them at the right temperature and pH. Add glycerol or sucrose to prevent aggregation and keep mbp active. When you follow best practices, you get consistent results and strong protein yields.
FAQ
How do you confirm fusion protein expression levels using Takara protein markers?
You run SDS-PAGE with Takara protein markers beside your fusion sample. You compare the bands to the marker. You check the size and intensity to estimate fusion protein expression levels. You use controls to verify accuracy in your experiment.
What steps help you increase the yield of maltose-binding fusion proteins?
You optimize growth conditions for your host cells. You use buffers with maltose to stabilize fusion proteins. You select the right purification method. You monitor expression levels and adjust induction time. You check for effective yield after each step.
Why does maltose improve fusion protein purification?
Maltose binds to the fusion tag. This helps you separate fusion proteins from other cell proteins. You use amylose resin for affinity purification. You elute fusion proteins with maltose. This process increases purity and yield.
What causes low fusion protein expression levels?
You may use the wrong vector or host strain. You might have poor codon usage. You could have incorrect fusion design. You may not add enough maltose to your buffer. You check each factor to improve fusion protein expression levels.
How do you remove the fusion tag after purification?
You use proteases like TEV or 3C. You incubate your fusion protein with the enzyme. You separate the cleaved fusion tag using gel filtration or affinity chromatography. You check the final protein for purity and yield.